
It’s time for another server post! I know I know, “isn’t this supposed to be a 3D printing blog?!” Don’t worry more of that content is coming, I promise 🙂 Anyway, having a fault tolerant stack is great, but whats the point if you are never notified when something breaks. I want to know instantly when a server goes offline, when a CPU is maxed out, when we are running out of disk, or if a mouse farts near my rack. Ok, maybe not that last one, but one can dream! To pull this off there is only one free and open source monitoring tool for the job: Zabbix.

Zabbix does more than just nag you like a toddler pulling on your pant leg when something goes wrong. It provides fantastic graphics and dashboards for all your resources in near real-time. Plus, its a cracked out Swiss army knife when it comes to collecting data, via agents, SNMP, APIs, HTTPs, scripts, or even manual entry if you enjoy self mutilation. But before we start collecting we need to get it installed!
How to Install an Alarm System
Zabbix has straight forward instructions for getting things up and running. Traditionally you’d do this on a fresh server with nothing on it. However, I’m running a Virtualmin environment because I want to incorporate other services outside of Zabbix in the future. The problem is Apache in Virtualmin serves files typically from /home/zabbix/public_html, but Zabbix doesn’t live there. So, the document root in the Apache config needed to be changed to /usr/share/zabbix/ in order to serve the right files.

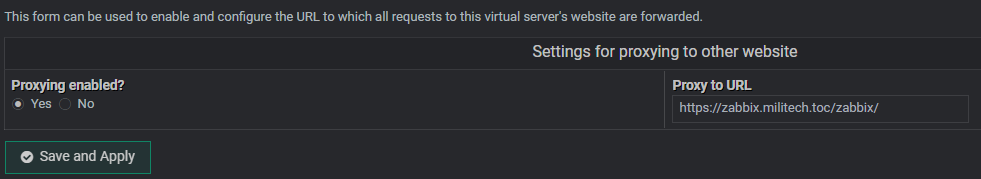
As an extra bonus, I got sick of adding /zabbix/ to the end of my URL every time to get to Zabbix. So I included an internal proxy re-direct to make apache automatically serve the link to zabbix.militech.toc/zabbix/ but keep the URL zabbix.militech.toc/ Oh the minor details…
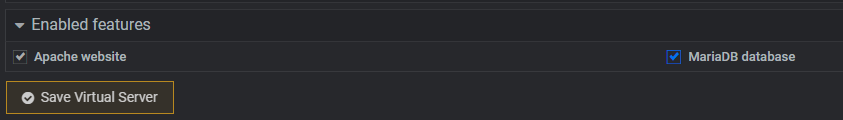
Last item to setup is the database, which again Virtualmin makes it easy. By going into the initial virtual server setup and checking off the MariaDB feature, it auto generates a new DB for me with login.
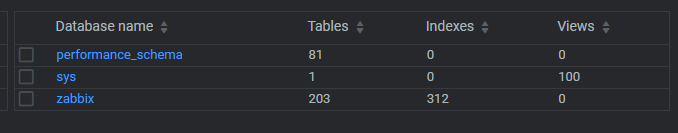
After following the instructions from the install, applying the DB schema and hooking up the config DB credentials, tables pop into existence and the DB starts to flesh out.
With fingers, toes and eyes crossed, hoping that I did everything right, going to https://zabbix.militech.toc/ it should show me a zabbix login page. Drum Roll…..

HAZA! I totally pulled that off in one go! Definitly didn’t take me an hour to get working! Now typically I just dive right in start pulling random levers. This time around, I decided to do something unthinkable, I decided to plan out the deployment.

I know, but trust me, if you’ve seen these confusing ass templates you’d do the same thing. Let me show you!
Templates: the Copy + Paste of Zabbix
If used right, templates can be a massive time saver. I say used right because they can also make a huge mess by collecting and alerting you about irrelevant things. But I’m getting ahead of myself, let’s focus on getting them setup. How about a template for the stack itself, the physical servers running this site? Luckily Zabbix comes loaded with pre-baked templates, Proxmox being one of them!
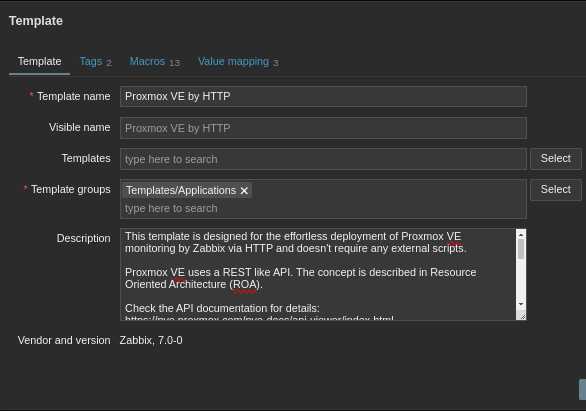
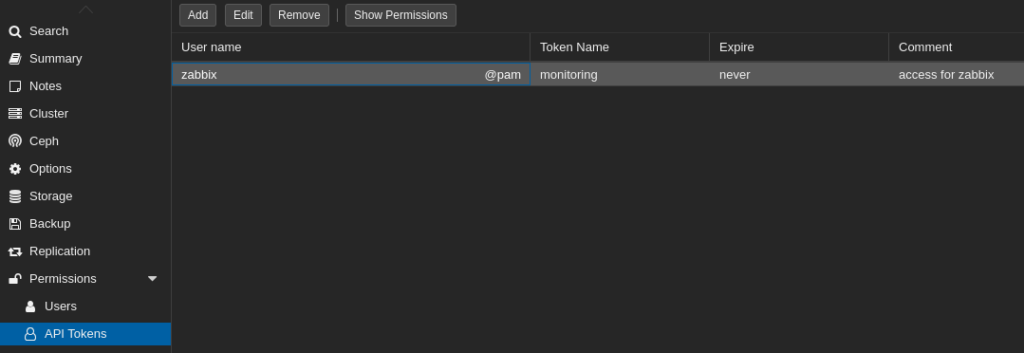
The Proxmox template integrates via HTTP by calling various APIs and parsing JSON responses. There is a little bit of setup here, creating an API User and token in Proxmox to allow Zabbix to get the data.
So now that Zabbix has a way to securely get the data, there is one useful thing I should mention about templates. Did you know you can nest them? What I mean is instead of modifying the vanilla Proxmox template, you can create a custom template and then link it. This allows you to make lots of lots of mistakes, regret going down the path you did, delete your template and just make a new one and link it again.
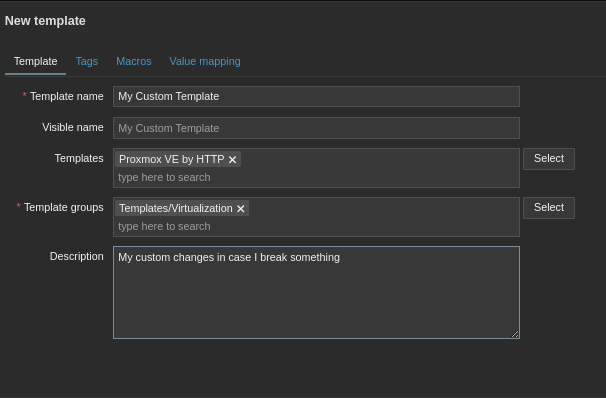
Moreover, you can also mix templates! Like if you find one that specializes in ICMP and another that scrapes network traffic on Cisco devices, link them both into one template. Just don’t get too carried away… Like I mentioned before, mixing too many together can get messy fast. Ok we’ve got our Custom Proxmox template, lets go into the next segment, Items, Triggers and Discovery Rules!
Template Anatomy 101: Items, Triggers and Discovery Rules

Lets go over them! Each template will come with a slew of items, triggers and discovery rules. Items are how Zabbix gathers metrics on the target. Metrics like CPU usage, Memory Usage, Disk space. How often to get that info and how long we need to hang onto that info is pre-defined but you can change it.
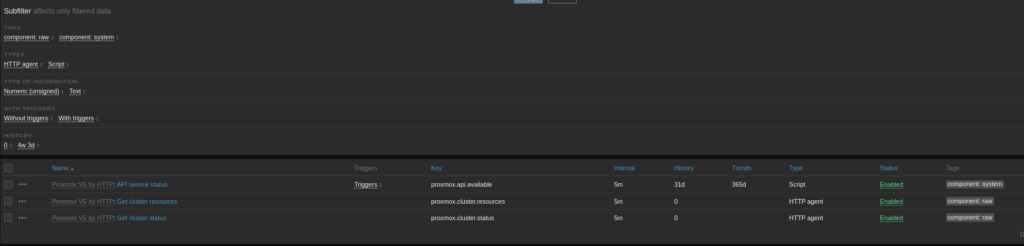
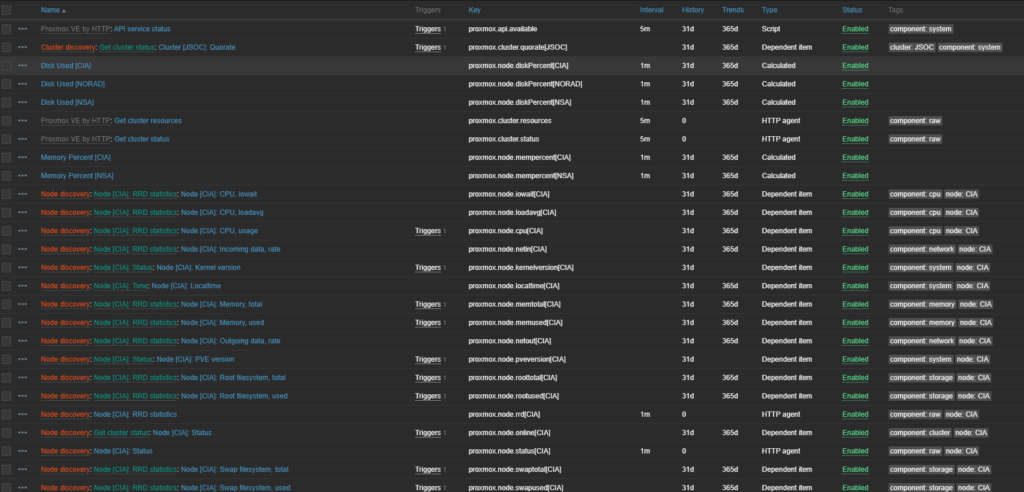
For my Proxmox servers, because its HTTP calling an API, the items listed here are
- is the service up?
- is the cluster OK?
- GIVE ME MOAR CLUSTER DATA
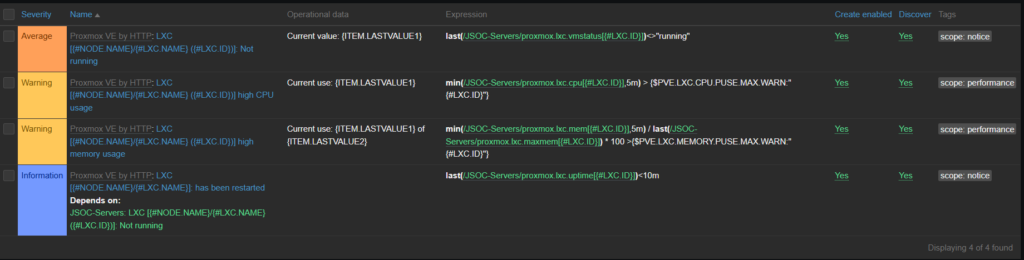
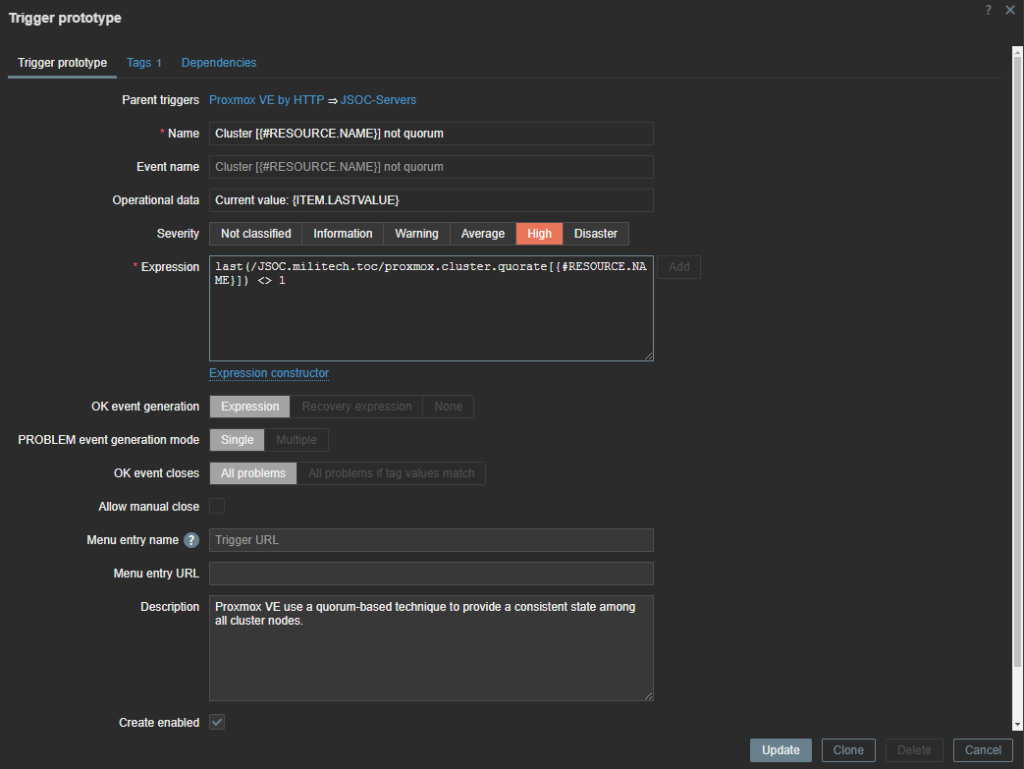
Notice on the API service item it has a trigger tied to it! Triggers are the alarm system of Zabbix. They go into full panic mode when an item gives them a value they don’t like. The trigger for API status is waiting for the API status item to give it something that is not an HTTP 200.

When Zabbix gets triggered, it then shoots off a message via whatever media channels you want. Email, teams, slack, discord, text, all viable options. If you are really feeling fancy, triggers can tell Zabbix to fire off custom scripts to do anything on a trigger event. Reboot the server, shut down the NIC, turn all the lights off in the house, the possibilities are endless! Alright, lets move onto the last and most complicated part of the template, discovery rules!
Discovering Discovery Rules using Discovery with Discoveries in Zabbix

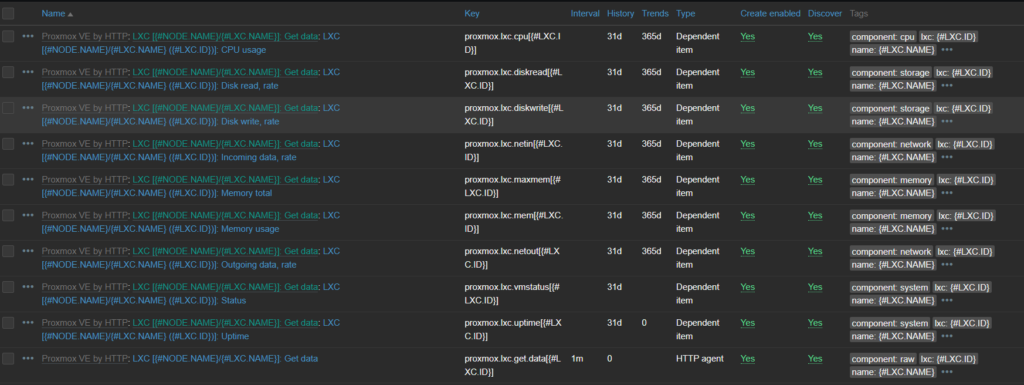
Yeah, hold on tight for this one… Discovery rules are item/trigger generators for the template. Think of them like reusable functions in programming, feed them variables and they generate from there. For example, you have a switch with 48 ports, instead of creating items for each port to watch for activity, you can create a discovery rule to say “give me the port ID and I’ll generate the activity item for it”.
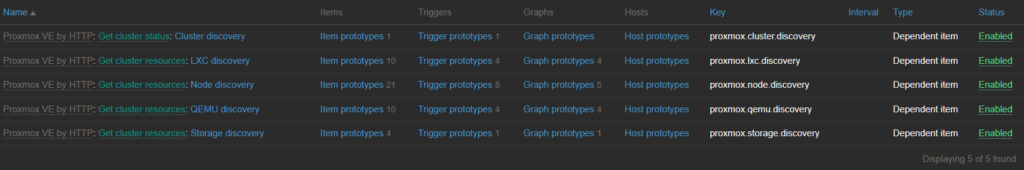
In my case, the Proxmox template has several discovery rules, one being LXC discovery. This rule looks at the all the resource components for each node in the cluster and creates items for each one. Saving me lots of time from setting all these items/triggers up for each resource on each node!
I know, I know. This is probably the part you are saying “the hell is he talking about?! I’m so confused…” Trust me, this will make a lot more sense later once we start gathering data and see things in action. So why don’t we do just that, lets plug this template into our stack!
Time for a Live Fire Exercise!
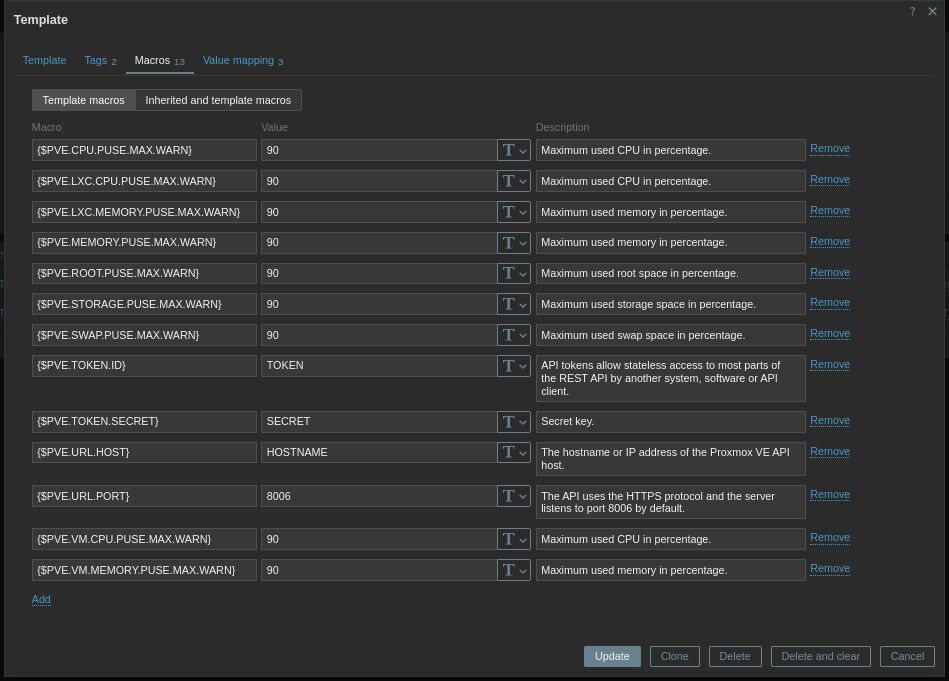
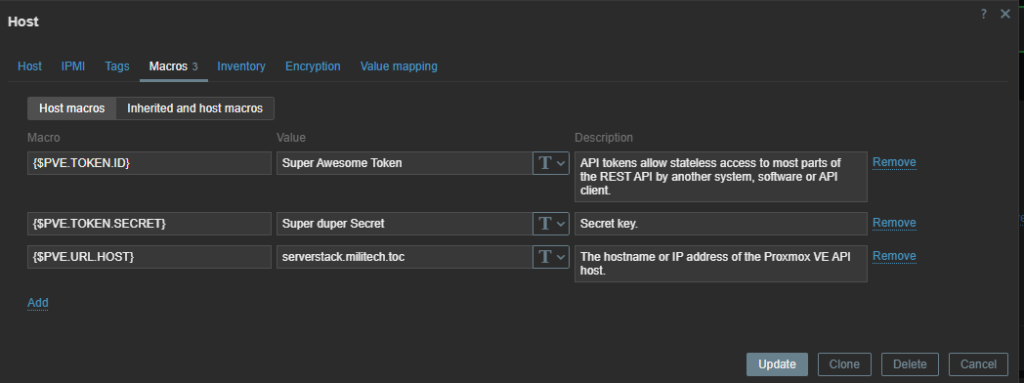
Alright, we start with making a new host, under the data collection menu! In creating a new host, we tell it we want to our custom template, which again is really just the Proxmox HTTP template. The important bit here is I need to jump to the Macros Tab and look at the inherited variables. Those macro variables are how this template is going to reach out to our server. Remember, I made the Zabbix API user in Proxmox, so I can feel the template here with a token, secret and tell it where the host is.
After a few minutes, if Zabbix is able to reach the host and the credentials are correct, you’re items, triggers and discovery rules should start populating! Keep in mind in the Proxmox template, we only had 3 items defined, now there is 175 items! Thank you discovery rules!
In red you can see what discovery rule applied, Green in what criteria/dependency was found and blue for what item was made. Per host you can modify items, how often it gets info, how long it hangs onto that info, change the type of info, or disable the item entirely.

Same applies to triggers, although it might be a good idea to let things run for a bit. It helps to see how sensitive your trigger settings are, allowing you can adjust things based on how many emails you get in the middle of the night.
Now that covers the main servers and a general idea of how our individual VMs are doing. But what if I want a lot more detail on what is going on in my VMs. That’s where the Zabbix agent comes in!
Zabbix Agents 007: Active and Passive
The Zabbix Agent, a little program that makes your assigned NSA agent jealous, watching everything that moves on your computer. There are two types of Agents, Active and Passive.

Passive agents will wait for the server to reach out to it asking for data. The server sends the agent the template framework and it fills out whatever it can in response. Since the agent is running on the host directly it has access to much lower level components!

Active Agents on the other hand don’t wait for the server to ask for info. They just shove it over in intervals, moving the work from the server to the agent. This is ideal for large scale monitoring but for my less than 50 machines, passive agents will do fine.
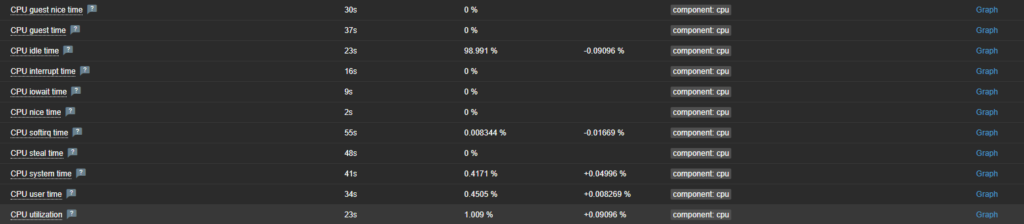
With the agent running directly on the machine or VM, I have access to low level components! I don’t even know what half of those CPU items do, but if I need them I have them!
But what do you do when you have a device where an agent can’t be installed or its a device that has no interface? This is where SNMP comes in!
The Simple Network Management Protocol is not Simple
If you thought Discovery Rules were complicated, hold onto your butts! I’d like to think when they named this acronym it was a cruel joke… or it was simple in 1971. Anyway, in Zabbix you can feed it SNMP OID patterns to have it collect data on network devices, printers, IoT devices, whatever takes SNMP really.

I’d say this is where templates come to the rescue but the reality OIDs are super picky. If the template isn’t the exact make and model of whatever you are trying to get info out of, its very likely not going to work. That or your are just going to have the wrong information. The way I cheat through this problem is install snmp on linux so I can use the snmpwalk command. This command basically has the console vomit out all of the OIDs and their values.
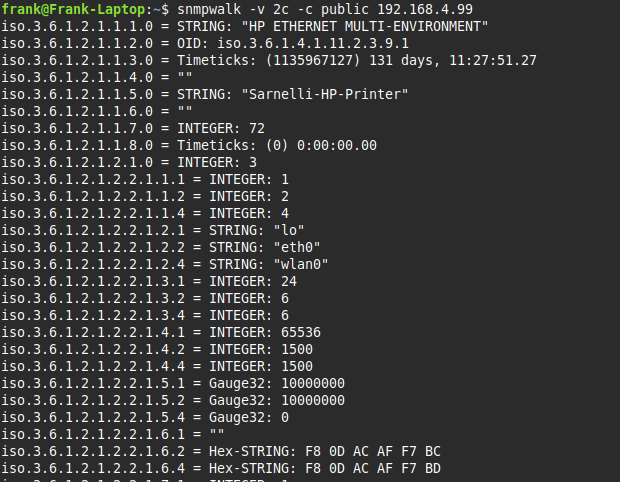
Aaand if that all looks like gibberish to you, you are not alone! This is the part I take the entire output, feed it to Grok and ask it to give me the bits I care about. With the right OID numbers I can create items for the host I want to access. If there are enough items or if I have other similar hosts, I’d create a template for this.
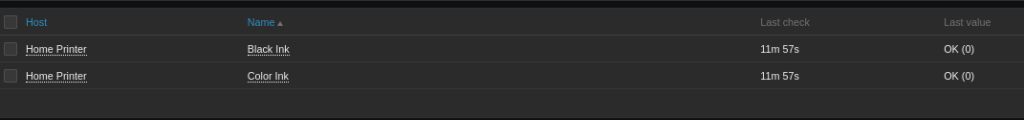
Now when my printer runs out of ink, I can get an email for it!
Dashboards: Making Picasso Proud
The last topic I want to drool over is dashboards! Having a bunch of items, triggers and graphs is cool, but wouldn’t it be cooler to see them all at the same time on one screen?! Whats the point in collecting all this data if we can’t display it in a really cool way!
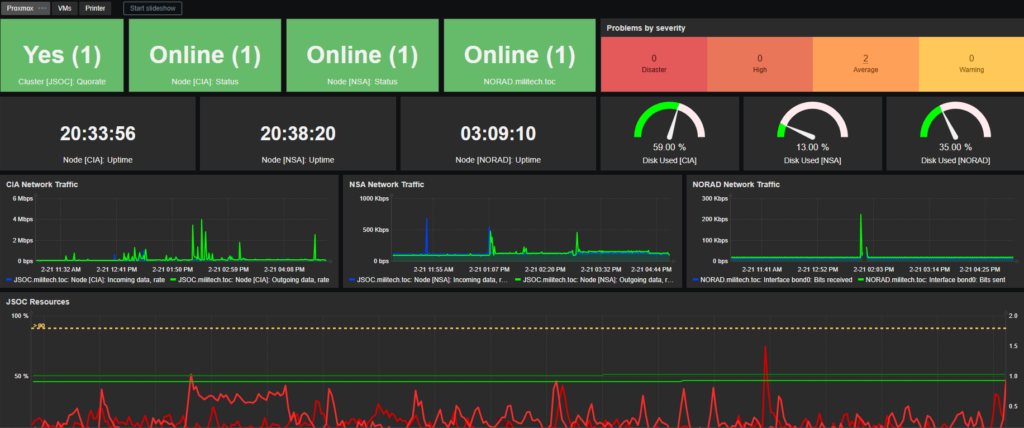
Dashboards, about as powerful as all the ways you can collect info, is a critical part to monitoring the stack. This allows me to organize important data cleanly and efficiently. Notice the legends in the graphs, displaying multiple data sets. The up-time shown as an actual clock counter and the availability shown as a card that changes color depending on its state.
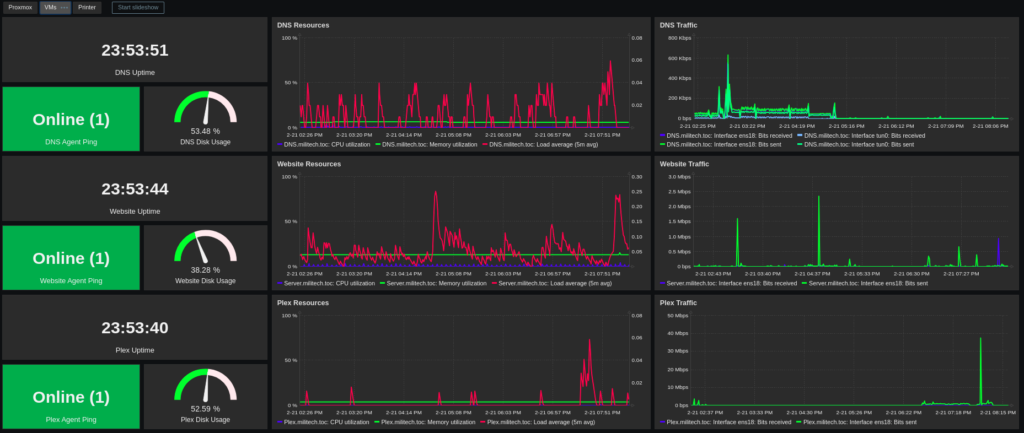
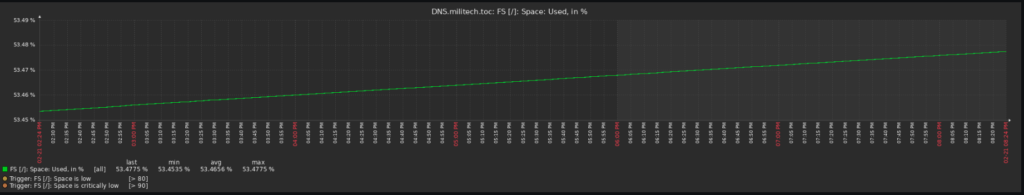
You can even do tabs within a dashboard to showcase even more data! In my VM tab, I have it organized where I get a snapshot of how each VM is doing. Again, multi-dataset graphs and gauges that change color depending on how full the disks get. And if you want to drill down how long the disk has been that full? Click on the gauge and it will take you to a history graph!

The Thrill of Getting the 3 AM Alert Email
Having fault tolerant hardware is only part of the equation, it needs to be balanced with a proper alert system. What’s the point of RAID if you don’t know your first drive died a month ago?! It also gives you a chance to see how things are running and if anything is constrained and in need of an upgrade. The more data you can see, the more action you can take. Just not too much data where it’s white noise and everything is on fire.

Well, that is all for this one, next few post will probably be on the technology track since I’m on a roll with these server projects. I do have some 3D printing jobs coming up so we’ll see if we can sneak a post or two about those. Until next time!